Support
|
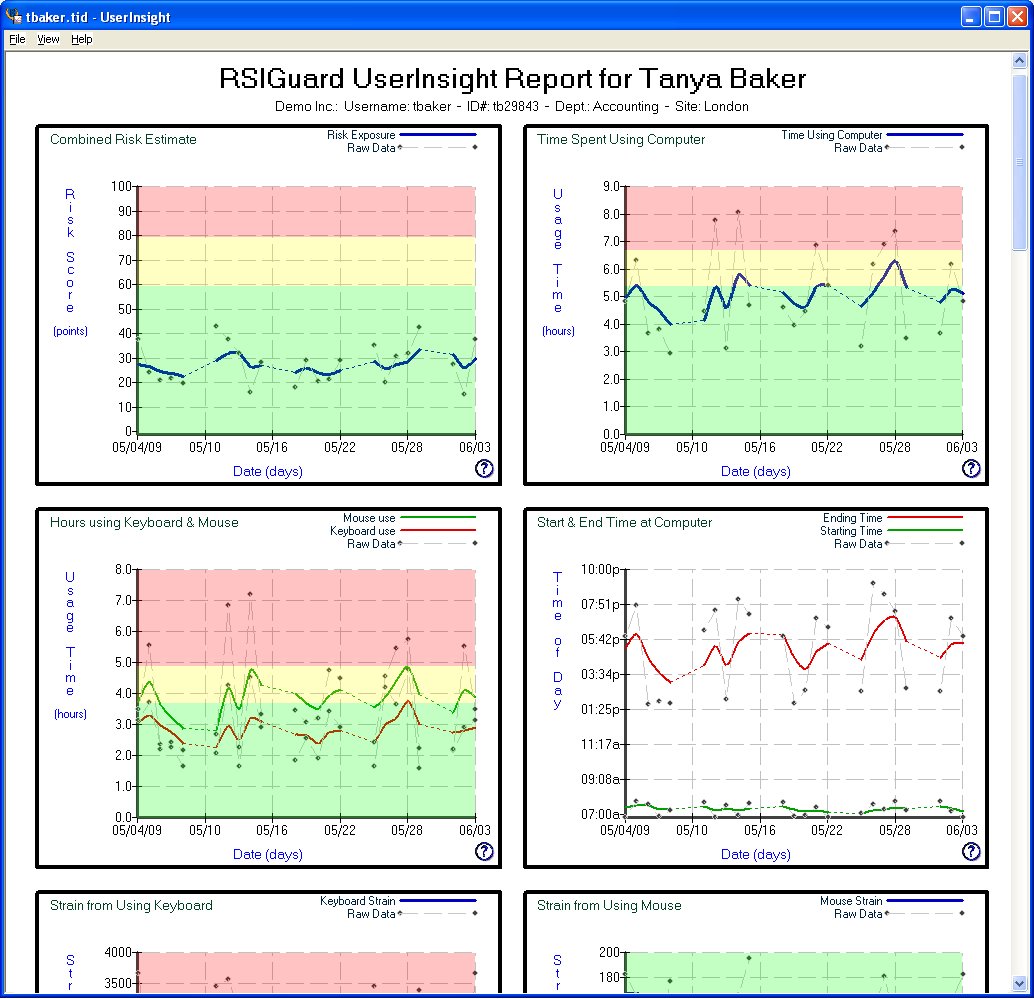
RSIGuard Reports ScreenshotsThe following screenshots from RSIGuard Reports show DataLogger data in various available viewing formats.
This sample shows 1 month of data. The dashed lines show actual values (raw data) for each day, whereas the smoothed lines show trends in the values.
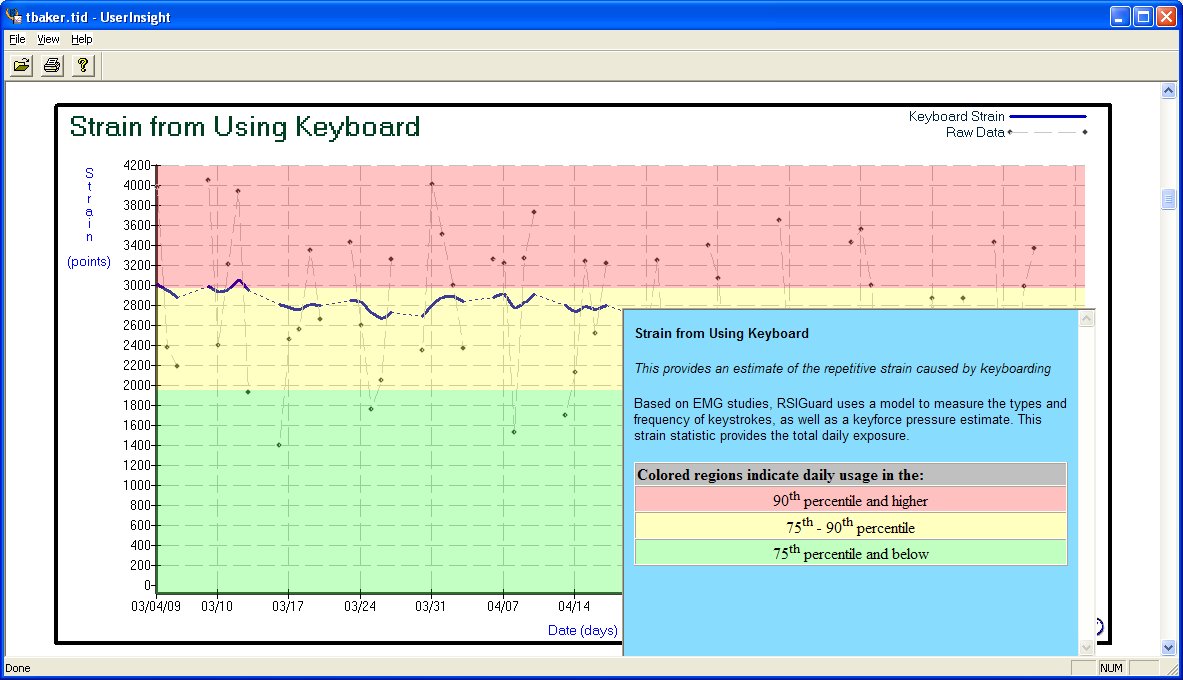
This sample shows 3 months of data. In this example, only the smoothed data is shown and the graph area is larger to allow better viewing of subtle changes in data. The mouse is hovering over the context help button, so the context help shows to explain this graph.
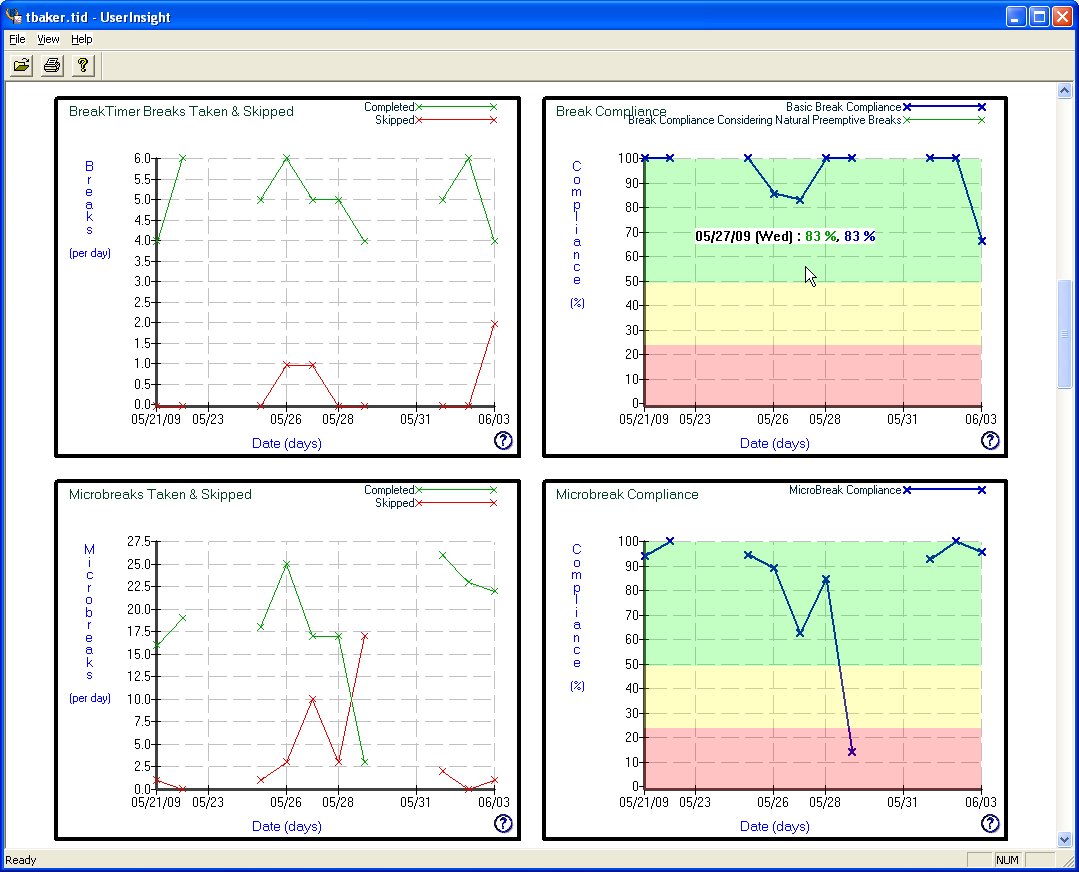
This sample shows smaller graphs for a 2 week period. Only raw data is shown to allow for easy viewing of actual data values. Note that in the top-right graph, because the mouse is positioned over this graph, the tool shows the actual values of data for the day being pointed to by the mouse.
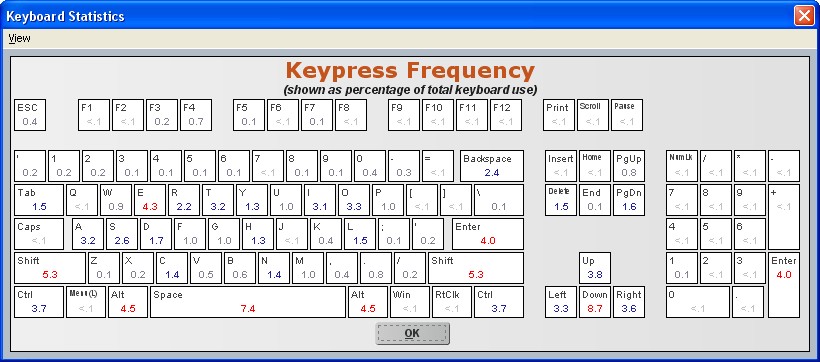
This sample shows detailed key usage information. Each key shows how often that key is used as a percentage of all keystrokes. |